By Lucia Tramonte and Herb Emery, AIPR, UNB Fredericton
Since we began sharing our analysis of New Brunswick’s PISA math results, several questions have come up again and again. Here is how we answer them.
Can PISA tell us whether our education policies are working?
It can tell us a great deal, as long as we are honest about what kind of evidence it is. PISA is a repeated, independent, internationally benchmarked measure of what fifteen-year-olds can actually do. It can’t be adjusted by changing a grading policy, and it has used the same scale for over twenty years. That makes it one of very few tools able to detect whether a system-wide change helped or hurt.
What PISA can’t do on its own is tell us which change caused what. It gives us the pattern. Policy records, curriculum documents, timetables and administrative data have to supply the explanation. The right way to use PISA is as an alarm, and then to go looking for the cause.
Isn’t it unfair to judge a province on one international test?
It would be unfair to judge a school or a teacher on it. PISA isn’t designed for that. But judging a system is exactly what it is designed to do. And New Brunswick’s results are not marginal. The province is last in Canada on two independent measures and has the country’s largest increase in students who can’t do basic math. That signal has been consistent across the last two cycles.
Why does math carry more weight than reading?
Because math is overwhelmingly learned at school. Children encounter reading everywhere: at home, on screens, in libraries, in conversation. Very few learn fractions, algebra or geometric reasoning outside a classroom. When math results fall, the school system is much closer to being the direct cause. Math is the cleanest available audit of what schools actually deliver.
What would real accountability look like?
A serious accountability loop would publish what is meant to be taught, what is actually taught and what students can do, in a form that can be compared year to year. It would measure timetabled hours against hours actually taught, and content genuinely covered against content merely listed. It would report results to parents in terms they can act on, early enough for action to matter. It would treat outside providers and agencies as part of the system, held to the same outcomes. And it would accept a simple truth: a system that stops measuring will, in time, stop noticing.
Is this the result of New Brunswick’s inclusive education model?
The honest answer is that these data can’t settle that question. Anyone claiming otherwise, in either direction, is going beyond the evidence.
What the data do show complicates the usual arguments on both sides. If inclusion were harming outcomes mainly by pulling attention away from struggling students, we would expect the damage to be concentrated at the bottom of the class and among disadvantaged families. That is not the pattern. New Brunswick’s losses are largest among its strongest students and wealthiest families.
That pattern fits a classroom where instruction covers a narrower band of content, so students who would once have gone furthest are simply not taken as far. It also fits several explanations unrelated to inclusion policy. Sorting them out requires evidence on what is being taught, to whom and for how many hours. A test score distribution can’t do that. Inclusion deserves its own evidence, and we should insist on gathering it properly rather than settling the question by assertion.
How solid are these numbers?
The 2003 to 2022 figures come from published PISA results and from analysis of the underlying student data, with proper standard errors and adjustments for small shifts in test scales between cycles. The big findings, including the long decline, the loss at the top and the shrinking middle group, were visible well before 2025.
One caution: the narrowing of the rich-poor gap is a pattern, not a statistically proven change, because the measurement error on those gap figures is large. The fall in absolute performance is firmly established.
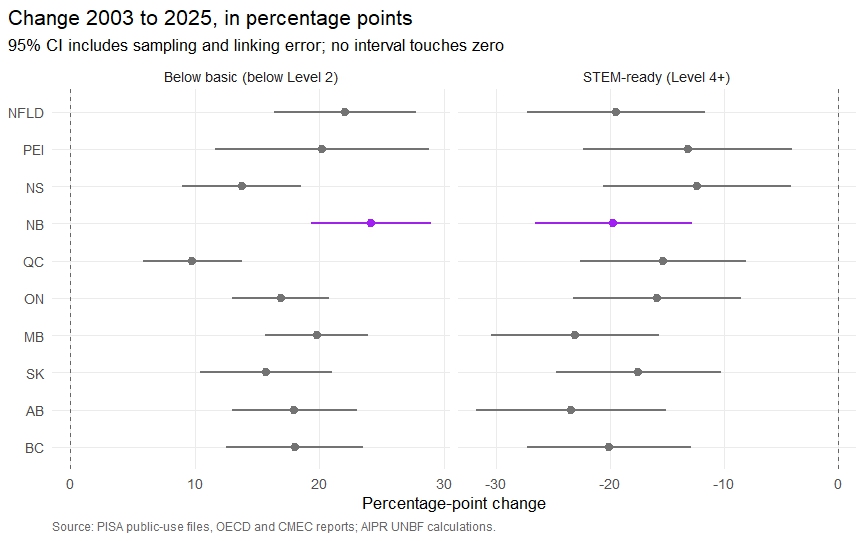
Figure 1. Change from 2003 to 2025 in the share of students below basic and the share STEM-ready, by province, with 95% confidence intervals that include PISA’s linking error.
Isn’t this just poverty or changing demographics?
That argument is hard to sustain. If the province were simply getting poorer, the damage would be concentrated among disadvantaged students. Instead, children from the wealthiest quarter of families lost more ground than children from the poorest quarter. Economic disadvantage doesn’t explain why the best-off homes saw the steepest fall.