By Lucia Tramonte and Herb Emery, AIPR, UNB Fredericton
New Brunswick’s PISA mathematics results have fallen sharply over two decades. Today about two in five fifteen-year-olds (38.5%) cannot do basic mathematics, and only about one in six (15.8%) is strong enough for a science, technology, engineering or mathematics pathway after high school, the weakest figures in Canada on both counts. The losses have been steepest among students who were previously strongest and among wealthier families. These data describe the pattern but don’t identify a cause. What follows is an interpretation. It fits the pattern, but the data alone don’t prove it. We present it as a hypothesis with a clear test attached, not as a conclusion.
The hypothesis
When results fall hardest among the students who were previously strongest, and in the families best placed to support learning, the simplest explanation is that less mathematics is being taught. Not necessarily taught worse, but taught less, and taken less far.
A weaker student loses ground when instruction is poor. A strong student loses ground when instruction stops short. New Brunswick’s pattern looks more like the second than the first.
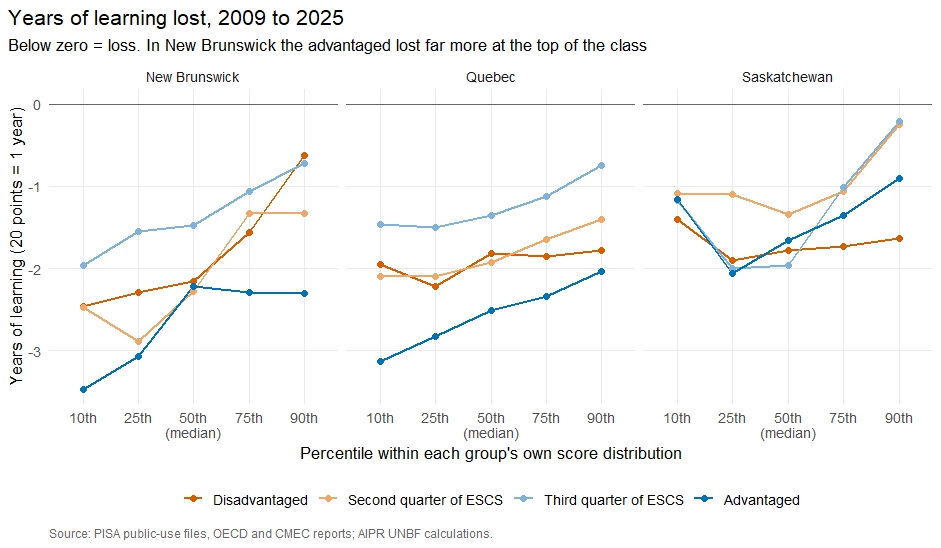
Figure 1. Years of learning lost from 2009 to 2025 at each percentile of each quarter of homes’ own distribution: New Brunswick, Quebec and Saskatchewan (20 score points = about one year).
At the heart of this is the difference between the curriculum as written and the curriculum as delivered. A syllabus can list content that is never reached. Hours can be timetabled and then absorbed by other activities. Topics can be introduced and never consolidated. None of this shows up in policy documents. All of it eventually shows up in what fifteen-year-olds can do.
Four supporting arguments
- Math is the subject schools can’t outsource. Reading skills build up outside school. For most children, math skills don’t. A child who isn’t taught fractions won’t pick them up at the kitchen table. That makes math results an unusually direct measure of what the school system delivered, and makes a decline harder to blame on social change outside the school.
- Less time, and less math inside the time. Two reductions compound each other: less instructional time overall, and less math within the time that remains. The second is harder to see, because a math period largely given over to other activities is still recorded as a math period. Where textbooks have fallen out of use without a comparably structured replacement, there may be no lasting record of what was covered. Parents, receiving teachers and auditors have no way to see how far a class actually got. A system can lose a third of its content this way without any document ever saying so.
- Less testing breaks the conversation with parents. Regular assessment isn’t mainly a measurement tool. It is how a school and a family discover together, early enough to act, that a child is struggling. When testing is reduced and results aren’t discussed frankly, that early warning disappears. The families best equipped to act on such information are the advantaged ones. Switch off the signal, and the households with the most capacity to respond lose the most. That may help explain why New Brunswick’s decline is steepest where you would least expect it.
- Outside agencies without a shared accountability loop. When a system stops measuring and reporting, the space doesn’t stay empty. Tutoring services, private assessment, community programs and commercial platforms move in. Some do good work, but they answer to different people, use different standards and report to no one in common. The result isn’t a system with extra help. It is a system whose accountability loop has been broken into disconnected pieces, where no single body holds a complete picture of what a child has been taught or can do. Families who can afford to buy in partly compensate. Families who can’t, don’t. And the public system loses the feedback it needs to correct itself.
How to test it
These questions can be answered, and they are worth putting to the department:
- How many hours of math instruction were timetabled per year in each grade in 2009, 2015, 2019 and today, and how many were actually delivered?
- Which topics in the written curriculum are reported as covered by the end of each grade, and how has that changed?
- What share of math classrooms use a structured, sequenced core resource, and how has that changed over fifteen years?
- What province-wide math assessments existed each year, who saw the results, and when did the results reach parents?
- How has the amount of math reaching the top of the class changed, for example enrolment and outcomes in advanced high-school math courses?
- Did the provinces that steadied after 2022, such as Nova Scotia and Saskatchewan, do anything differently on any of these dimensions?
If instructional time and content coverage held steady while results collapsed at the top of the class, this hypothesis is wrong and should be dropped. If they fell, it deserves to be at the centre of the policy conversation.