By Lucia Tramonte and Herb Emery, AIPR, UNB Fredericton
Every few years, fifteen-year-olds across Canada and around the world sit the same test. It is called PISA, the Programme for International Student Assessment, and it is run by the OECD. In Canada, it is delivered with the Council of Ministers of Education, Canada (CMEC). PISA doesn’t ask whether students memorized this year’s curriculum. It asks whether they can use what they have cumulatively learned in mathematics, reading and science to solve real problems.
PISA has three features that make it valuable. It is independent: provincial marking standards and grading policies don’t affect it. It is repeated: it has been given on the same scale for more than twenty years. And it is benchmarked: we can compare New Brunswick with every other province and with about 90 countries and economies around the world.
It is equally important to say what PISA is not. It is not designed to assess any individual student, teacher or school, and it should never be used that way. PISA describes education systems and the groups within them.
A quick guide to the language
When we analyze PISA, we often talk about “the strongest students” or “the weakest students.” We don’t mean named individuals. We mean positions in the distribution: the level reached by the top tenth or the bottom tenth of students in a given year, whoever they happen to be.
We also use proficiency levels. Students below Level 2 cannot reliably do basic, everyday mathematics, and the United Nations treats Level 2 as the minimum for functional numeracy. Level 3 is solid, middle-of-the-road competence. Students at Level 4 and above are strong enough to be plausible candidates for a science, technology, engineering or mathematics (STEM) program after high school. As a rough rule of thumb, 20 PISA points is about one year of schooling. That figure helps communicate scale, but it is not a precise measurement.
What we learned from 2003 to 2025
Math achievement has fallen in every Canadian province over the past two decades. New Brunswick started near the back of the pack. Today it sits last on the two measures that matter most.
More students can’t do basic math. In 2003, about one New Brunswick fifteen-year-old in seven (14.3%) could not perform basic mathematics. In 2025, it is two in five (38.5%). That is the largest increase in Canada. The share rose significantly in all ten provinces, so this is a national problem that New Brunswick experiences most severely.
The strongest students have quietly disappeared. The share of students strong enough for a STEM pathway has fallen from more than a third (35.5%) to about a sixth (15.8%). Both figures are now the worst in the country. The solid middle of the class has thinned as well, from 27% to 21%, the smallest such group in Canada. The share of students sitting at exactly the basic level has barely moved. In other words, students have been drained out of the strong and middle groups and deposited below the basic line.
The children of wealthy families fell furthest. Between 2009 and 2025, students from the wealthiest quarter of homes lost more ground than students from the poorest quarter, at every point of their group’s score distribution we examined. The weakest students from wealthy homes lost about 70 points, roughly three and a half years of learning. The strongest lost about 46 points, more than two years. The poorest quarter also lost ground, but their strongest students were the most protected group in the province.
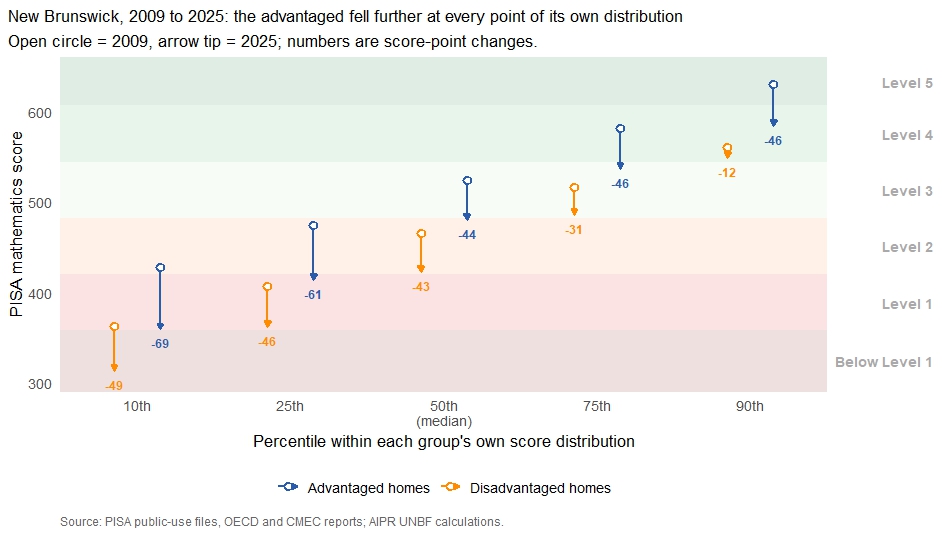
Figure 1. New Brunswick math scores in 2009 and 2025 at each percentile of the poorest and the wealthiest quarter of homes, shown against the PISA proficiency levels. Each group is compared with itself, because the same percentile corresponds to a different score in each group.
One striking comparison makes the point. A student in the weaker half of the wealthiest quarter scored 413 in 2025. The equivalent student from the poorest quarter scored 407 in 2009. Sixteen years of decline have wiped out the entire advantage of a well-off home at that point in the class.
The shrinking gap is not good news. New Brunswick now has the smallest gap between rich and poor students of any province. Among its strongest students, the gap has vanished into statistical noise, the only province where that has happened. On paper, that looks like an equity success. It is not. The gap closed because advantaged students fell toward disadvantaged ones, and both groups ended up lower than before. (The narrowing is a consistent pattern rather than a statistically proven change. The fall in absolute performance is firmly established.)
This didn’t start with the pandemic. The decline in Canadian math begins in 2003. New Brunswick was fairly stable until about 2018, then fell sharply in 2022 and again in 2025. The pandemic sits inside that acceleration. It can’t explain the twenty years before it, and it can’t explain why other provinces in similar regions or with similar socioeconomic profile like Nova Scotia and Saskatchewan steadied after 2022 while New Brunswick did not.
How we compare. Quebec remains Canada’s strongest performer, with about a third of its students still STEM-ready, but it is also falling. The difference is that Quebec’s decline is spread evenly across rich and poor, weak and strong. Saskatchewan’s decline is milder, and its strongest students from wealthy homes held their ground entirely. New Brunswick is the outlier in shape: its losses are concentrated at the top of the class and among advantaged families.
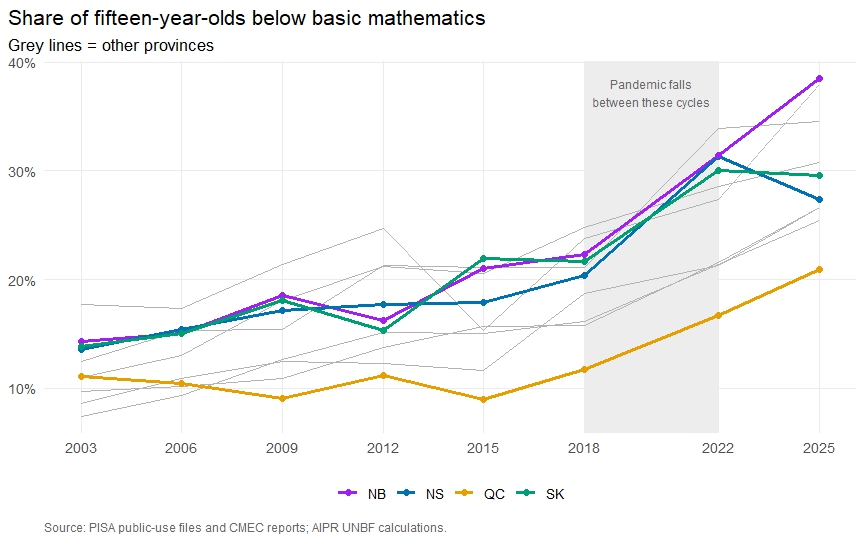
Figure 2. New Brunswick’ percentage of students performing too poorly to meet SDG4 minimum threshold, over time. Comparison with Nova Scotia, Quebec, and Saskatchewan.